Order Manager Dashboard
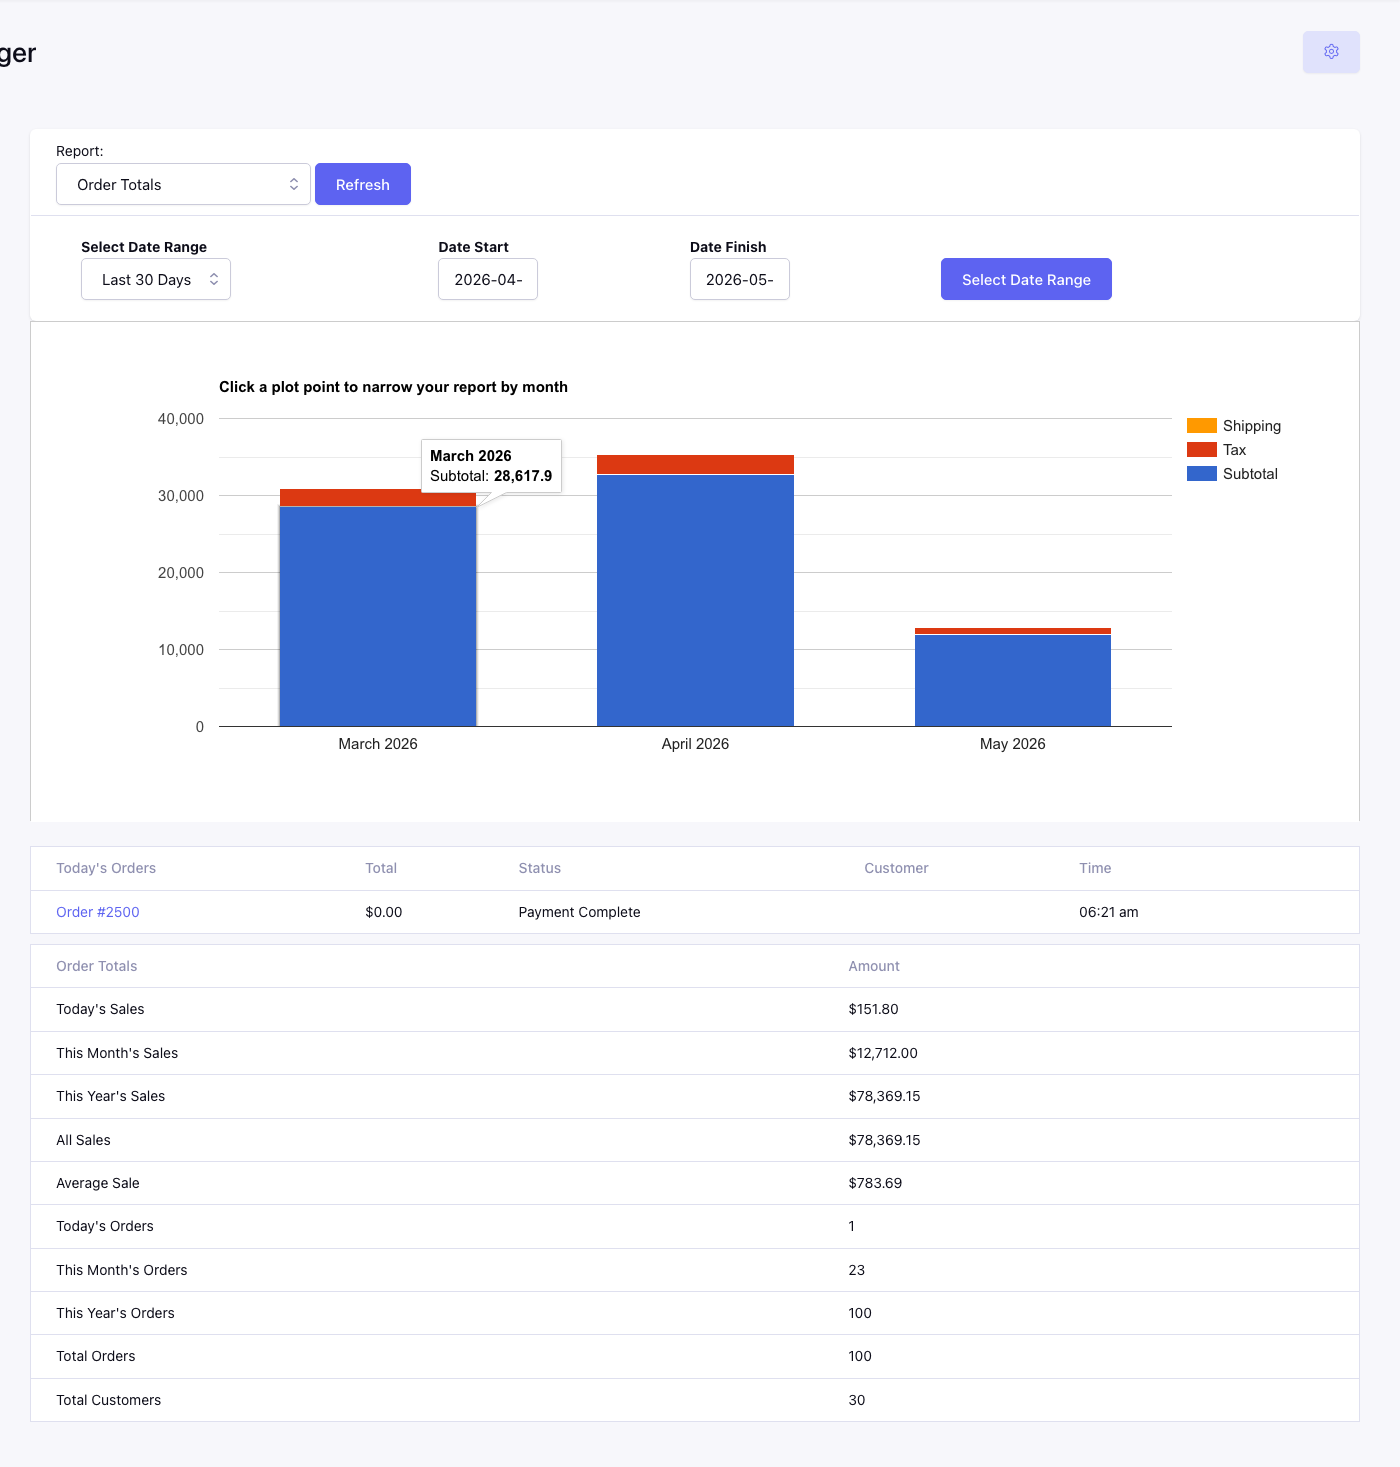
The dashboard gives staff a quick operational view of store activity. It combines a date-filtered sales graph, recent orders, summary totals, and an optional custom report.
Report selector
The Report selector controls the report shown beneath the dashboard graph. The built-in Order Totals view is always available. Templates configured as custom reports under Settings also appear here.
Select a report and choose Refresh to render it. A custom report is parsed as an ExpressionEngine template in the control panel; it does not automatically inherit the dashboard’s filters unless its tags use equivalent criteria.
Date controls
Use Select Date Range for a preset:
- Last 30 Days
- Last 3 Months
- Last 6 Months
- Last Year
The Date Start and Date Finish fields display the active range and can be used for a custom range. Applying a new range recalculates the graph and dashboard totals.
Sales graph
The stacked graph separates:
- subtotal;
- tax; and
- shipping.
Graph points support progressively narrower drill-downs. A month can open its daily activity, a day can open hourly activity, and the most specific order point can open that order’s detail page.
The graph reflects saved order data. It is not a payment-gateway settlement report and should not be used by itself for processor reconciliation.
Recent orders
The recent-orders table shows the order, total, status, customer, and time. Selecting an order opens its Order detail page.
Summary totals
The totals table includes current-period and all-time values such as:
- today’s, this month’s, this year’s, and all sales;
- average sale;
- today’s, this month’s, this year’s, and all order counts; and
- total customers.
The current-period values follow the dashboard’s selected date range where applicable.